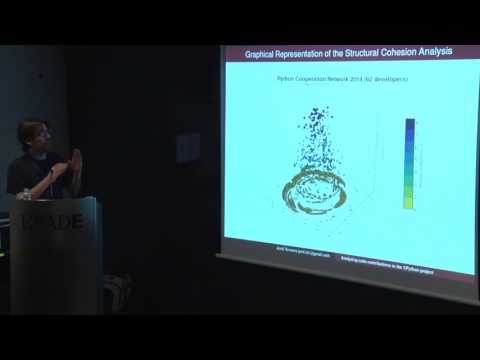
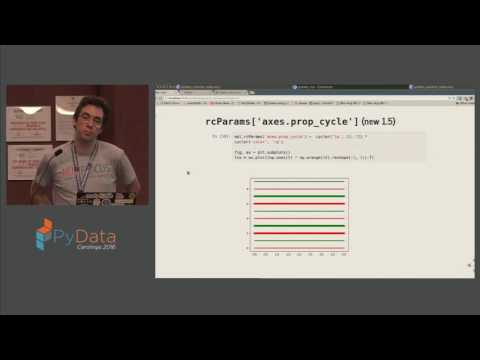
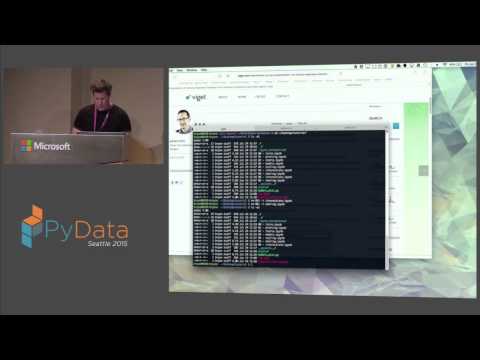
39:30 Jordi Torrents - Analyzing code contributions to the CPython project using NetworkX and Matplotlib PyData
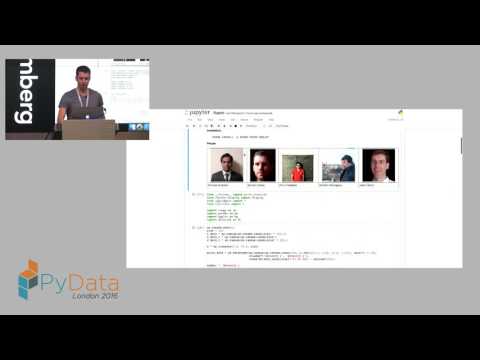
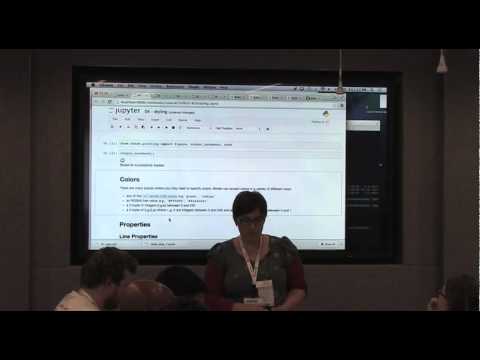
40:38 Sylvain Corlay - Interactive Visualization in Jupyter with Bqplot and Interactive Widgets PyData
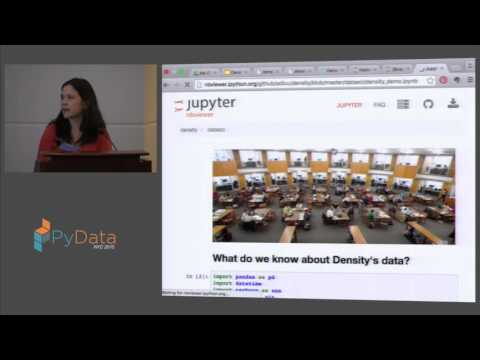
22:21 Jessica Forde: Visualizing Wireless Router Timeseries Data with the Density API, Seaborn, and Pandas PyData
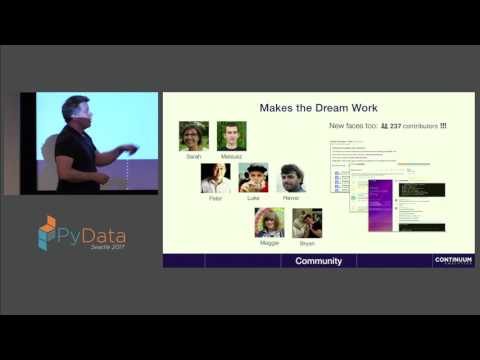
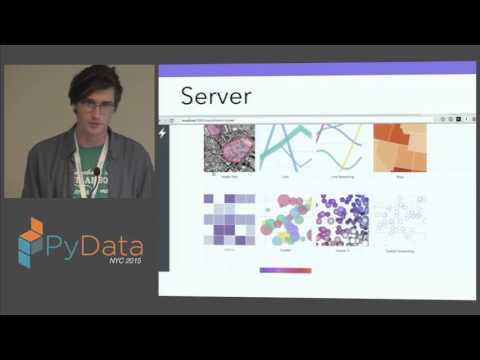
1:56:05 Andy R. Terrel and Christine Doig - Building Python Data Applications with Blaze and Bokeh PyData
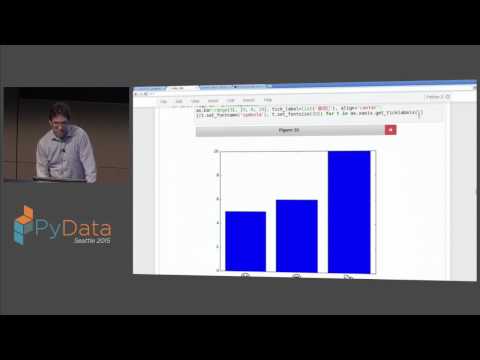
39:50 Jason Sundram - A Full Stack Approach To Data Visualization Terabytes and Beyond at Facebook PyData
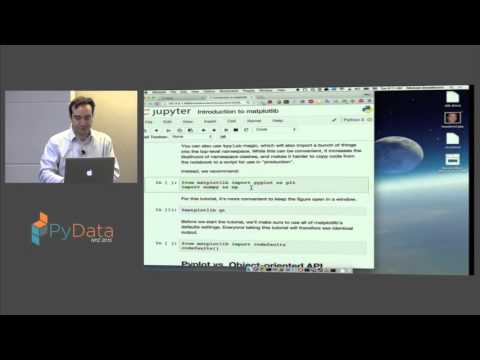
55:22 Bryan Van De Ven - How to Create Interactive Browser Visualizations from Python with Bokeh PyData
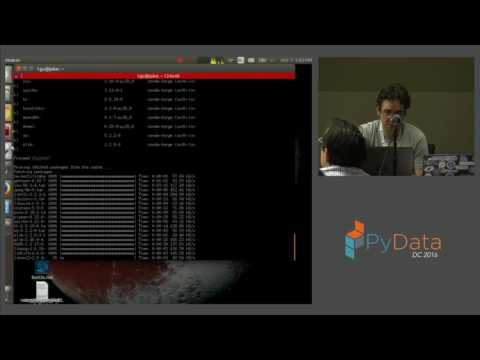
27:52 Russell Burdt: Build and deploy a Python bokeh application on a Linux server | PyData Miami 2019 PyData
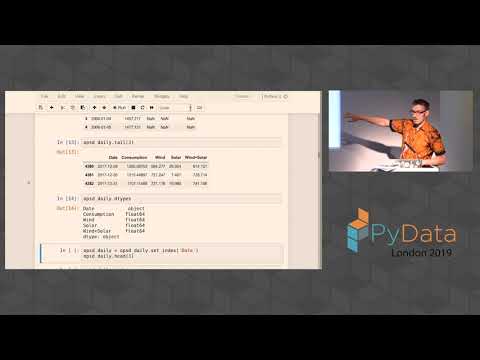
1:24:08 Ian Ozsvald: A gentle introduction to Pandas timeseries and Seaborn | PyData London 2019 PyData
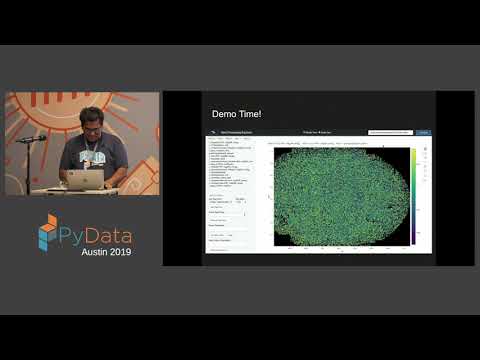
30:53 Dharhas Pothina: Building a User Maintainable Visualization Dashboard for... | PyData Austin 2019 PyData
30:27 Dom Weldon: Dash: Interactive Data Visualization Web Apps with no Javascript | PyData Berlin 2019 PyData
35:33 Kevin Chrzanowski: Bokeh Maps - Interactive Map for Your Next Web Application | PyData LA 2019 PyData
23:43 Ekhtiar Syed: Exploratory Data Analysis (EDA) and Visualization Techniques.. | PyData Eindhoven 2019 PyData
37:44 Dash: Interactive Data Visualization Web Apps with no Javascript - Dom Weldon (PyData Prague #5) PyData
9:57 Brian Lucas- Enquiry Based Learning for Science and Engineering utilizing Bokeh| PyData Global 2020 PyData